


We have launched E-mail Alert service,subscribers can receive the latest catalogues free of charge

Regional Gap: Status Quo and Future Trends
Dec 13,2004


Li Shantong,Hou Yongzhi,He Jianwu & Xuan Xiaowei
I. Changes in Regional Gap since Reform
1. Changes in the regional gap as measured by the Gini coefficient and the coefficient of variation
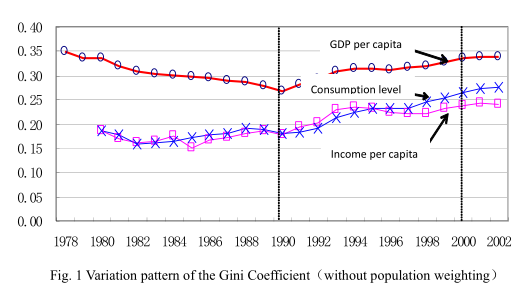
(1) From the foundation of new China 1949 to 1978, China implemented a balanced regional development strategy. However, in the early years of reform the gap was still great between the eastern, central and western parts of the country. There were changes after an adjustment in the regional development strategy as a part of the reform. As can be seen from figure 1, the gap in per capita GDP sharply narrowed from 0.3494 in 1978 to 0.2658 in 1990. However, the gap was widened quickly in the 1990s and slowed down later. Since the year 2000, the gap almost stood stably at 0.337 and is currently lower than that in 1978.
The changes in consumption level vary in a different manner between regions. The gap stood stable at 0.17 prior to 1990 and varied in the same way as GDP per capita after 1990, rising from 0.18 in 1990 to 0.26 in 2000. The gap in the consumption level has been widening after 2000. The current figure is higher than that in 1980, i.e., an early year of the reform. That indicates a faster improvement in the living standard of residents in the economically advanced areas.
The regional gap in income per capita varies in almost the same pattern as that of the consumption level.
(2) As indicated by the changes in the regional gap since 1990, the regional gap widens sharply when the economy grows at a fast pace and less so when economic growth slows.
(3) As seen from Fig. 1, the gap in GDP per capita between each provincial unit is greater than that in the consumption level as well as the income per capita between the urban and rural residents. In the long run, the three curves of GDP per capita, consumption level and income per capita of urban/rural people tend to converge. This points to a revenue shift between regions, mainly the shift of focus towards the inland China in the central budget. That also indicates the important role of the central government in coordinating the development process. Moreover, support rendered by the economically advanced provinces and central governmental agencies to the education and medical care sectors in central and western regions, particularly the western region of the country, contributes to the improvement of the living standards and social progress there.
2. Regional gap as measured by the human development index
(1) Considering the acceptability of statistics, we adjust the UNDP approach by replacing the enrollment ratio with average years of schooling; replacing GDP per capita in terms of PPP with GDP (fixed price in 1990). Also different from the Human Development Report approach, the threshold values are defined as the maximum and minimum values for each index. This will not influence the judgment on the relative gap in HDI between provincial units. It turns out that the three provincial units with the highest HDI in 2000 were Shanghai, Beijing and Tianjin and the three with the lowest HDI were Tibet, Guizhou and Qinghai.
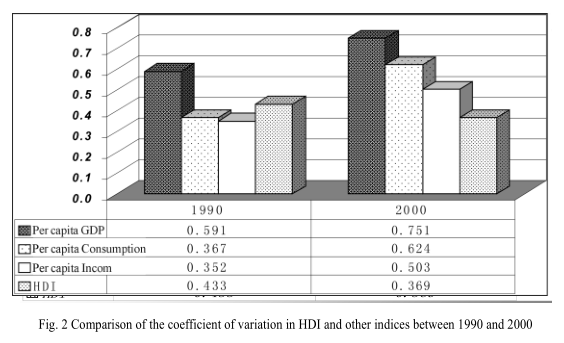
(2) The regional gap in HDI narrowed from 1990 to 2000 with the coefficient of variation (not weighted by population) decreasing from 0.433 to 0.369.
(3). It is worth noting that the gap in GDP per capita is greater than that in HDI between provincial units. That is to say, the disparity in economic development level is greater than that in social progress. See Fig. 2.
3. Disparity between the eastern, central and western China as well as within provincial units
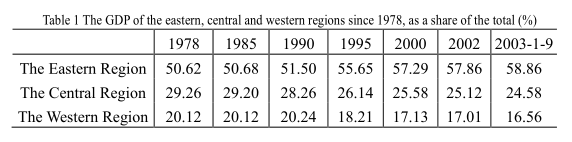
(1) In the previous three quarters of 2003, the eastern region contributed 58.86% of the total GDP of the country, 8.24% up from 50.62% in 1978, the central region contributed 24.58%, 4.68% down from 29.26% in 1978, while the western region contributed 16.56%, 3.56% down from 20.12% in 1978.
(2) In 2002, the per capita GDP was RMB 14,159 Yuan in the eastern region, 6,961 in the central and 5,472 in the western, with the former 2 times and 2.6 times higher than the latter two.
(3) Gaps are arising both between and within regions. Take Guangdong and Shaanxi Provinces as examples.
--- In 2002, the per capita GDP was 34,295 Yuan in the Pearl River Delta. However, that figure was only 6,558 Yuan for the mountainous counties and 4,477 Yuan for ethnic minority counties. The former was 5.5 and 7.7 times the latter two. The coefficient of Gini measuring the disparity in per capita GDP within Guangdong Province was 0.4409, above the national average.
--- In 2002, the per capita GDP was 6,759 Yuan for the central part of Shaanxi Province, 4,339 Yuan for the north and 3,302 Yuan for the south of the province, with the former 1.6 and 2.0 times higher than the latter two.
--- In 2000, with a per capita GDP of 30,215 Yuan, Taicang City ranked the first within Jiangsu Province, 10.9 times that of Suining County which ranked the lowest within the province with a per capita GDP of 2,776 Yuan.
4. Breakdown of the overall regional gap
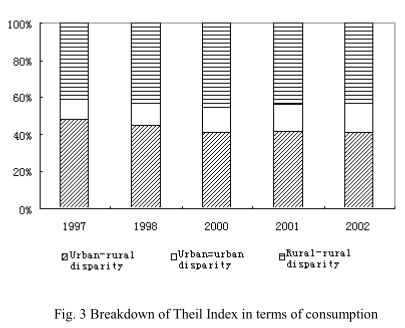
To provide a better insight into the reason why the overall disparity exists between regions, we decompose the Theil index as a measure of consumption inequality. The index breaks down into three parts: the urban-rural disparity, the urban-urban disparity and the rural-rural disparity. The results are shown in Fig. 3.
The following conclusion can be drawn from Fig. 3:
· The disparity between the urban and the rural and between the rural and the
rural contributes most to the overall gap.
Both the urban-rural disparity and the rural-rural disparity contributed over 40% of the overall gap. While the urban-rural disparity has occupied a decreasing share in recent years (down from 48% in 1998 to 41% in 2002), the rural-rural disparity has increased slightly from 41% in 1998 to 42% in 2002. This shows the urban-rural disparity and the rural-rural disparity are the most important source of gaps.
·The urban-urban disparity contributes a smallest share yet with a fast
growth. Although only accounting for a small percentage, the urban-urban disparity has increased rather quickly (from 11% in 1998 to 16% in 2002). This indicates an ever-growing gap between cities in the development process.
...
If you need the full context, please leave a message on the website.


