


We have launched E-mail Alert service,subscribers can receive the latest catalogues free of charge

Urgent Need to Improve the Policies on Enterprises' Foreign Direct Investment
Dec 29,2011


By Zhang Liping & Guang Hao(Intern), Research Department of Foreign Economic Relations of DRC
Research Report No.110, 2011
For a more accurate and objective understanding of the situation of Chinese enterprises' foreign direct investment (FDI) and an understanding of their policy-related expectations, the Research Department of Foreign Economic Relations of the Development Research Center of the State Council conducted, with the support of the Bureau of Industry Injury Investigation of the Ministry of Commerce, a questionnaire survey of enterprises in terms of their basic profile, foreign investment, and policy-related expectations. A total of 697 valid questionnaires had been retrieved by July 4, 2010.
I. The Basic Profile of the Surveyed Enterprises
1. Regional distribution
This survey has a nationwide coverage, involving 28 provinces/autonomous regions/municipalities directly under the Central Government, namely Beijing, Shanghai Tianjin, Hebei, Henan, Anhui, Liaoning, Inner Mongolia, Guangdong, Ningxia, Gansu, Fujian, Qinghai, Shandong, Guangxi, Shanxi, Guizhou, Sichuan, Hainan, Yunnan, Hebei, Henan, Zhejiang, Hubei, Hunan, Jiangsu, Jilin, Heilongjiang, Jiangxi, and Xinjiang. The number of surveyed enterprises from Anhui, Liaoning, Sichuan, Hubei, and Henan is fairly large -- over 50 from each. The regional distribution of the surveyed enterprises is shown in Table 1.
Table 1 Regional Distribution of the Surveyed Enterprises
|
Region |
Number |
Region |
Number |
|
Anhui |
52 |
Liaoning |
72 |
|
Beijing |
7 |
Inner Mongolia |
14 |
|
Fujian |
22 |
Ningxia |
5 |
|
Gansu |
30 |
Qinghai |
17 |
|
Guangdong |
25 |
Shandong |
18 |
|
Guangxi |
34 |
Shanxi |
3 |
|
Guizhou |
4 |
Sichuan |
80 |
|
Hainan |
9 |
Tianjin |
11 |
|
Hebei |
27 |
Yunnan |
11 |
|
Henan |
63 |
Zhejiang |
28 |
|
Hubei |
67 |
Jiangsu |
3 |
|
Hunan |
13 |
Shanghai |
1 |
|
Jilin |
27 |
Heilongjiang |
1 |
|
Jiangxi |
12 |
Xinjiang |
39 |
2. Distribution by type
The private enterprises, which represent the majority of the surveyed enterprises, number 282 and account for 40.69% of the total. The collective enterprises, which claim the least portion, number only 27 and account for merely 3.9%. The foreign-invested enterprises and the state-owned ones number 219 and 165 respectively, and account for 31.6% and 23.81% of the total number respectively (Figure 1).
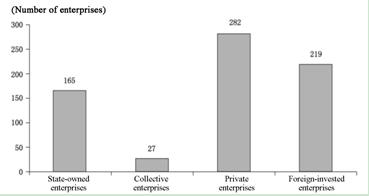
Figure 1 The Types of the Surveyed Enterprises
The foreign-invested enterprises show a relative concentration of countries and regions where the foreign investors are registered. The top three regions are Hong Kong and Macao, Japan, and the US, representing 44% of the surveyed foreign-invested enterprises. The largest portion is claimed by Hong Kong and Macao enterprises, which number 68 and account for 20% of the total number; the runner-up is Japanese enterprises, which number 43 and account for 15%; in the third place is American enterprises, which number 19 and account for 9% (Figure 3).
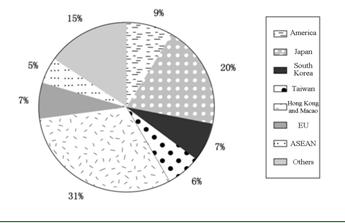
Figure 2 The Countries/Regions Where the Foreign-invested Enterprises are Registered
3. Distribution by industry
Table 2 shows the distribution of the surveyed enterprises by industry. The coverage of the survey is large in this respect because the questionnaires were handed out randomly. Most of the surveyed enterprises, 112 in number, are from the following industries: textile, clothing, shoemaking, headwear, leather, fur, and feather products. Next are from food, beverage, and tobacco, which are represented by 95 enterprises. Still next is general-purpose and specialized equipment manufacture, which is represented by 64 enterprises.
Table 2 The Distribution of the Surveyed Enterprises by Industry
|
Industries represented |
Number of enterprises |
|
Food, beverage, tobacco |
95 |
|
Textile, clothing, shoemaking, headwear, leather, fur, feather products |
112 |
|
Timber processing and wooden, bamboo, rattan, palm fiber, and straw products; papermaking and paper products |
22 |
|
Petroleum processing, coking, and nuclear fuel processing |
2 |
|
Raw chemical materials, chemical products, chemical fibers |
70 |
|
Pharmaceutical industry |
15 |
|
Rubber products |
15 |
|
Plastic products |
15 |
|
Nonferrous mineral products |
16 |
|
Ferrous metal and nonferrous metal smelting and rolling, metal products |
55 |
|
General-purpose and specialized equipment |
64 |
|
Transportation equipment |
36 |
|
Electric machinery and equipment |
34 |
|
Communication equipment, computer, and other electronic equipment |
29 |
|
Instruments, meters, and office machinery |
10 |
|
Other industries |
107 |
4. The internal/external sale structure
Please refer to Figure 4 for the proportion of export in the total sales among the surveyed enterprises. For the largest part of them, the proportion is below 25%. More specifically, such enterprises number 328 and account for 49.4% of the total sampled number. This shows that, for most of the enterprises, foreign markets are not the focus of their business, representing less than 1/4 of their sales. The export percentage of 93 surveyed enterprises is between 25% and 50%, and that of 210 of them exceeds 50%. For these, export markets are the focus of their sales. Among them, 43 enterprises are purely foreign trade ones, with an export rate of 100%.
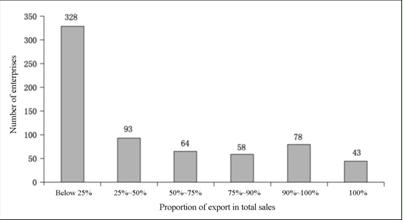
Figure 3 The Proportion of Export in Sales
In terms of the major export markets, the top three are Southeast Asia, Japan and South Korea, and the US, represented by 147, 115, and 73 of the surveyed enterprises respectively (Figure 4), according to the number of selected enterprises.
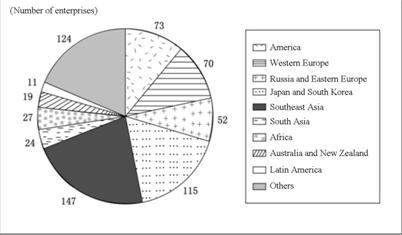
Figure 4 Major Export Markets
II. Enterprises are Inactive in Foreign Investment
There is a general lack of activity in foreign investment among the surveyed enterprises. Only 61, or 8.98% of them, are engaged in foreign investment; over 90% of them are not at all.
1. Analysis of the enterprises that have made investment
(1) Distribution by country/region. Foreign investment from among the surveyed enterprises is mainly directed at the Asia-Pacific region, including North America, Japan, South Korea, and Southeast Asia. A total of 20 surveyed enterprises have invested in these regions (Table 3).
Table 3 The Main Countries/Regions Receiving Foreign Investment
|
Country/region |
Number of enterprises |
|
Western Europe |
4 |
|
North America |
9 |
|
Japan and South Korea |
6 |
|
Australia and New Zealand |
2 |
|
Emerging economies in Europe, including Russia and Eastern European countries |
4 |
|
Emerging economies in Southeast Asia |
5 |
|
India and other South Asian economies |
4 |
|
Central Asia and Mongolia |
1 |
|
Middle East |
3 |
(2) The main economic activities of foreign investment. As Table 4 shows, trade and marketing (52.38%), processing and production (42.86%), and R&D (20.63%) are the three primary activities. They are followed by brand management (15.87%), post-sale service (14.29%), and the obtainment of energy and resources (11.11%).
Table 4 Main Economic Activities of Foreign Investment
|
Economic activities |
Percentage (%) |
|
Trade and marketing |
52.38 |
|
Processing and production |
42.86 |
|
R&D |
20.63 |
|
Brand management |
15.87 |
|
After-sale service |
14.29 |
|
Obtainment of energy and resources |
11.11 |
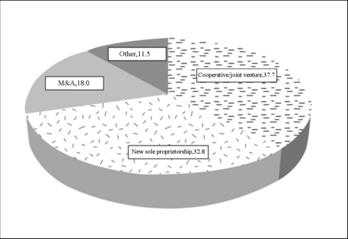
(3) Approaches to foreign investment. In this respect, 37.70% of the enterprises have chosen the establishment of new cooperative enterprises or joint ventures, 32.79% have chosen to establish new sole proprietorships, and only 18.03% have chosen overseas M&A.
|
The role of foreign investment |
Percentage of enterprises (%) |
|
Expanding the market |
70.97 |
|
Generating more profit |
53.23 |
|
Improving international competitiveness |
45.16 |
|
Technological improvement |
32.26 |
|
Acquiring or creating international brands |
29.03 |
|
Increasing the operating rate of equipment |
29.03 |
|
Circumventing trade barriers |
27.42 |
|
Creating advantages by using lower costs overseas |
20.97 |
|
Overcoming the bottleneck of energy and resources |
20.97 |
|
Transferring surplus production capacity overseas |
12.90 |
(5) Foreign investment plans for the next five years. In this respect, of the 60 enterprises already engaged in foreign economic activities, only one intends to cut back on its foreign investment, whereas all the other 59 intend to at least maintain the present level. 43 of them intend to expand their foreign investment.
In terms of the selection of the target location of foreign investment, the vast majority (90.74%) of the enterprises choose to invest in other markets in addition to their current investment.
In terms of the foreign economic activities to be expanded, the survey shows a correspondence between the top three activities and the top three activities of on-going investment: 55.74% of the enterprises choose trade and marketing, 47.54% of them will continue to expand processing and production, and 42.62% of them will add R&D to their current activities.
Table 6 Foreign Economic Activities to be Expanded in the Next Five Years
|
Activities |
Percentage of enterprises (%) |
|
Trade and marketing |
55.74 |
|
Processing and production |
47.54 |
|
R&D |
42.62 |
|
After-sale service |
29.51 |
|
Obtainment of energy and resources |
26.23 |
|
Brand management |
16.39 |
|
Building overseas trade and economic cooperation parks |
3.28 |
Generally speaking, the current structure will be kept in the enterprises' economic activities in the next five years. However, considering that the percentage of enterprises choosing R&D for the future (42.62%, Table 6) is much higher than that of enterprises currently engaged in R&D (20.63%, Table 4), the proportion of R&D is expected to rise in all the foreign economic activities.
…
If you need the full text, please leave a message on the website.


