


We have launched E-mail Alert service,subscribers can receive the latest catalogues free of charge

Split of China's Monetary Finance from the Real Economy: Facts and Reasons
Aug 18,2015


By Chen Daofu, Research Institute of Finance of DRC
Research Report No 178, 2013 (Total 4427)
In recent years, the monetary finance has split apart from the real economy in China, thus dramatically dragging down the output efficiency of the monetary finance input. The financial market has allocated large amounts of financial resources into the fields with low output efficiency, such as infrastructure, overcapacity and the real estate. Some real economy sectors with obtained funds have further injected the resources into the sectors with low output efficiency through the financial market. The chain of the financial sector to serve the real economy draws longer and longer, and calls for increasingly higher returns. The cross-border fund flows have further exacerbated the disseverance between the financial sector and the real economy. There are various reasons accounting for the conspicuous crowding-out effect on the capital market, which are related to relevant systems and mechanisms on the real economy level, the deficiency of the transformation and supervision of the financial system, as well as easy policies in monetary and financial environments.
I. Monetary Finance and Real Economy Split Apart
Over the past few years, the monetary finance and the real economy has been split farther and farther apart, resulting in more and more monetary finance input, yet indicators like GDP and industrial added value have remained on a low level. Large amounts of monetary finance input have been allocated into industries with low output efficiency such as infrastructure, real estate and overcapacity, even idling of the monetary finance once occurred to a certain extent. Cross-border funds have flowed in and out in large amounts, which is not mainly due to the guidance of China's economic fundamentals. Domestic and overseas interest arbitrage has become the mainstream, further exacerbating the separation of China's present monetary finance from the country's real economy. Overall, obvious distortion has show up on China's capital market, shedding light on the "crowding –out effect".
1. The output efficiency of the monetary finance input dwindles
In recent years, measured by actual output, the output stimulation effect of the monetary credit availability has dwindled significantly. Both aggregate social financing (which refers to the external sources of finance obtained by non-financial businesses from domestic financial institutions and markets, including CNY loans, foreign currency loans, entrust loans, discount bank acceptance, stock financing, bond financing and relevant items) and newly increased monetary credit have grown rapidly, yet indicators reflecting economic growth (especially domestic demand) have dropped continuously. During 2005~2008, 1 yuan of social financing could bring along 4 yuan of GDP. Up to 2012, 1 yuan of social financing could only bring along 3.3 yuan of GDP. From January to June this year, 1 yuan of social financing could only bring along 2.44 yuan of GDP.
The velocity of money circulation (which refers to the times of money circulation within a given period, generally one year, weighed by the mean value of GDP/current M2) has decreased rapidly. In 1990s, the velocity of money circulation continued to drop slowly. During 2003~2008, the velocity of money circulation tended to stabilize. However, due to the overly easy monetary policy carried out in 2009, as well as the decrease of the monetary output efficiency, the velocity of money circulation dropped again in 2009 and 2012, from 0.71 in 2008 to 0.61 in 2009, and down to 0.57 in 2012. In the first half of 2013, the speed of the money increase still surpassed the nominal speed of GDP increase, and the ratio continues to decrease.
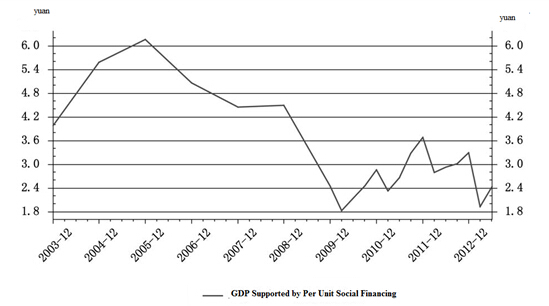
Figure 1 GDP Supported by Per Unit Social Financing
Source: Wind Information.
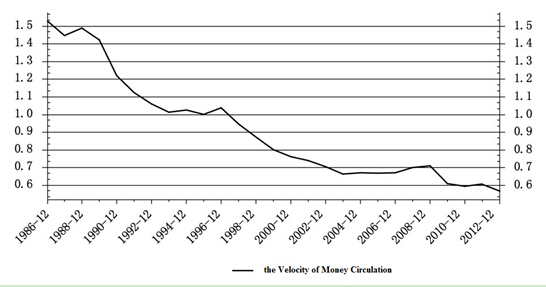
Figure 2 Changes of the Velocity of Money Circulation
Source: Wind Information.
The industrial added value deviates from M2 and increased aggregate social financing. Historically, the accumulative year-on-year growth of M2 and aggregate social financing and the accumulative year-on-year growth of industrial added value changed in the same direction. But from 2012 onward, deviations appeared in the performance of M2, aggregate social financing and industrial added value, with the accumulative year-on-year growth of M2 and aggregate social financing continuing to rise yet the accumulative year-on-year growth of industrial added value continuing to drop.
The liabilities of industrial enterprises did not grow simultaneously with M2 and aggregate social financing. The year-on-year growth of the liabilities of industrial enterprises continued to decrease since 2011, from 20.51% in September of 2011 down to 11.2% in May of 2013. The growth of aggregate social financing and money supply did not bring about the proportionate growth of the liabilities of industrial enterprises. It suggests that quite a part of financial resources did not flow into the industrial sectors of the real economy.
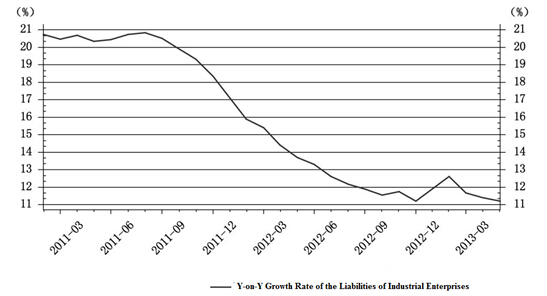
Figure 3 Y-on-Y Growth Rate of the Liabilities of Industrial Enterprises
Source: Wind Information.
2. Capital market distorts, shedding light on the "crowding-out effect"
China has made lots of monetary finance input, which have seemingly entered into the real economy sectors, yet loads of financial resources have been allocated into sectors and industries with low output efficiency. With implicit government and bank guarantee, or with expectations of the rise of real estate prices, some entities with low output efficiency and undesirable cash flows, such as infrastructures (local financing platforms), overcapacities and the real estate industry have earned high risk-adjusted returns and can still be widely recognized on the financial market and gain access to financing. In recent years, those entities are being either less sensitive to interest rates or are strong enough to bear the interest rates, whose fund demand has dominated the capital market and pushed up the market interest rates. By the end of March 2013, loans from local financing platforms and real estate loans had made up 35% of various kinds of loan balance, accounting for 2/3 of household consumption loans and medium- and long-term loans borrowed by non-financial businesses. From January to May 2013, urban investment bond financing made up 40% or so of enterprise bond financing. Like a "tumor" of the economy, urban investment bond financing absorbs the majority of money input, elbowing out the capital needs of some small and medium-sized enterprises.
…
If you need the full text, please leave a message on the website.


