


We have launched E-mail Alert service,subscribers can receive the latest catalogues free of charge

Challenges Brought by Demographic Changes in Yangtze River Delta and Countermeasures
Feb 15,2019


By Jia Shen
Research Report Vol.21 No.1, 2019
At the opening ceremony of the first China International Import Expo (CIIE) in 2018, President Xi Jinping announced to support the regional integration of Yangtze River Delta and make it a national strategy. Analyzing the population growth, flow and structure in the Yangtze River Delta in recent years can provide references for studying and formulating relevant policies for integrated regional development in the new era.
I. Changing Position of Yangtze River Delta in National Demographic Map
1. Total population in Yangtze River Delta is basically stable compared with national population
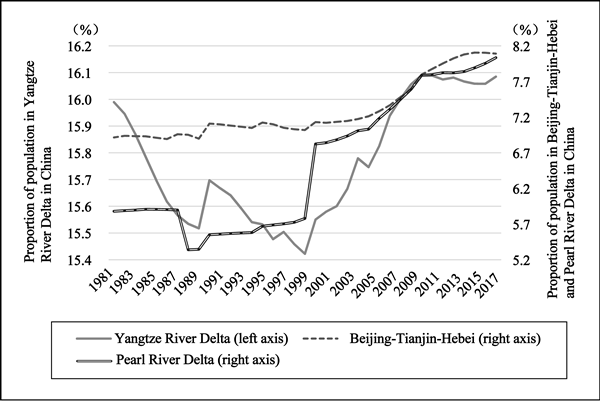
Since the reform and opening-up began, the Yangtze River Delta has been one of the fastest-growing regions, but its population aggregation effect wasn’t brought into full play until 2000. In 1999, the one city and three provinces in this region had 194 million residents in total, accounting for 15.42% in the country, 0.57 percentage point lower than in 1981 (Figure 1).
The 2000-2010 period witnessed the fastest population increase in the Yangtze River Delta, during which its total population increased by 1,978,000 people per year. In 2010, regional population accounted for 16.09% in the country, the highest point since the reform and opening-up.
 |
|
Figure 1 Proportion of population in three main city clusters of eastern China in national population |
Source: Calculated based on data on the website of National Bureau of Statistics, and data of Pearl River Delta includes the whole Guangdong province.
After 2010, eastern regions, except Yangtze River Delta, continued to attract population, but the proportion of the Delta in national population was stable. From 2011 to 2017, the proportion of population in Beijing-Tianjin-Hebei and in Pearl River Delta (Guangdong province) in the country rose 0.29 and 0.25 percentage point each, but the proportion of Yangtze River Delta dropped 0.01 percentage point to hit 16.08% in 2017 (Figure 1).
2. Population proportion of Shanghai and Jiangsu falls, that of Zhejiang rises slightly, and Anhui contributes most population increase in Yangtze River Delta
The population proportion of Shanghai and Jiangsu peaked in 2014 and 2010 respectively before it began to fall, and Shanghai’s absolute population of residents decreased in 2017. Anhui’s population proportion stopped falling and began to rise in 2012, while Zhejiang’s maintained steady increase. From 2013 to 2017, the permanent residents in Anhui and Zhejiang increased by 2.67 million and 1.8 million respectively, accounting for 45.0% and 30.3% of the increment in Yangtze River Delta during that period.
Regarding main cities in the region, Hangzhou, Ningbo and Hefei saw the fastest population increase in the Yangtze River Delta over recent years. In 2017, their residents increased by 280,000, 130,000 and 96,000 respectively, compared to the increase of 65,000, 58,000 and 24,000 in Nanjing, Suzhou and Wuxi, and the decrease of 17,000 in Shanghai.
3. Industrial upgrade and converging salary will affect regional employment and population increase in the long term
The reduced population growth in Yangtze River Delta isn’t a temporary change, but a long-term trend resulting from two major factors - the upgrade of industrial structure and the regional convergence of labor price.
In terms of industrial structure, with the exception of Anhui, manufacturing in Yangtze River Delta has basically shifted from labor-intensive to capital- and technology-intensive; in the service sector, modern service industries such as finance, IT and technological education are taking a growing proportion. The adjustment of employment structure triggered by industrial upgrade has an important impact on the population increase in Yangtze River Delta. From 2014 to 2017, the total number of urban employees in Shanghai, Jiangsu, Zhejiang and Anhui (hereinafter referred to as the “four places” or “one city and three provinces”) decreased by 166,000, 1,178,000, 482,000 and 55,000 people respectively. By industry, the total number of employees in manufacturing and construction industries in those four places decreased by 400,000, 1,123,000, 766,000 and 67,000 respectively, which accounted for 241.6%, 95.4%, 159.1% and 120.6% of the total reduction in urban employees. In comparison, urban employment in their service industry increased by 209,000, 85,000, 327,000 and 129,000 jobs respectively. The employment in service industry made up for the massive employment reduction in manufacturing and construction, providing important support for the stable growth of employment and population in Zhejiang and Anhui.
As far as labor price is concerned, the regional difference in the urban salary is converging thanks to China’s continuous improvement of the unified and open market system of orderly competition. In 2017, the per capita GDP in Shanghai, Jiangsu, Zhejiang and Anhui was RMB 127,000, RMB 107,000, RMB 92,000 and RMB 43,000 respectively, each being 2.14, 1.81, 1.55 and 0.73 times the national level. But the average urban salary in the one city and three provinces was respectively 1.75, 1.05, 1.09 and 0.88 times the national average. In particular, their salary in manufacturing was 1.64, 1.12, 1.01 and 0.92 times the national average. With the exception of Shanghai, the urban salary in Yangtze River Delta, especially in manufacturing, differed very little from the national average.
II. Recent Characteristics of the Size and Pattern of Population flow in Yangtze River Delta
1. Proportion of migrant population continues to fall in general
According to population census and sample survey results, the proportion of migrant population in Shanghai, Jiangsu, Zhejiang and Anhui was 55.1%, 23.2%, 36.6% and 11.9% in 2010, which became 52.8%, 21.3%, 31.7% and 13.2% in 2017, falling to varying degrees except in Anhui.
In comparison, Shanghai still has the highest proportion of migrant population in China, that in Zhejiang is obviously higher than national average (19.2%), but the proportion in Jiangsu is close to national average while that in Anhui is obviously lower than national average.
2. “Clustered concentration” of migrant population in the region According to the 2017 dynamic monitoring data of migrant population nationwide provided by the National Health Commission, we analyzed the sources of migrant population in main cities of the Yangtze River Delta, and found the following characteristics of population flow within the region:
...
If you need the full text, please leave a message on the website.


