


We have launched E-mail Alert service,subscribers can receive the latest catalogues free of charge

An Analysis of the Influence of China-Japan-Korea Free Trade Area on Manufacturing Industry of the Three Countries
May 06,2008


Zhang Qi,Lu Gang & Xu Hongqiang, Research Department of Foreign Economic Relations of DRC
Research Report No.204, 2007
I. Development of Manufacturing Industry is of Great Importance Respectively to China, Japan and Korea
1. The manufacturing industry plays a major role in the three economies
In 2006, the manufacturing industry accounted for 43.1% of China's GDP, higher than the share of the service industry (39.5%), making the industry the biggest sector in China's domestic economy. Number of employees in the manufacturing industry amounted to nearly 90 million, accounting for about 12% of the country's total. Jobs created in the manufacturing industry has made great contribution to easing the pressure of employment in China1.
In 2004, Japan's manufacturing industry accounted for 21% of its GDP, with the number of workers reaching 11.42 million, making up 18% of the country's total2. In 2005, Korea's manufacturing industry constituted 25.3% of its GDP, with the number of workers reaching 4.23 million, making up 18.5% of the country's total3.
2. All the three countries are major producers and exporters of manufactured products in the world
According to WTO statistics, the aggregate exports of manufactured products made by China, Japan and Korea in 2005 was more than 1500 billion US dollars, accounting for 20.6% of the world's total. The shares of China, Japan and Korea were 9.6%, 7.5% and 3.5%, respectively, making them the world's third, fourth and fifth largest exporter of manufactured products, respectively4.
China, Japan and Korea all had huge surplus in their trade of manufactured products. In 2005, Japan's trade surplus reached 270 billion US dollars, while China and Korea recorded a trade surplus worth of 207.2 billion US dollars and 100.1 billion US dollars respectively. The net exports of Korea's manufactured products contributed 12.7% to its GDP, and the corresponding figures for China and Japan were 9.2% and 5.9% respectively5.
II. An Analysis of the Competitiveness of Three Countries' Manufacturing Industry
1. A comparison of international competitiveness
By analyzing the index of revealed comparative advantage (RCA), we can see that the key industries of China, Japan and Korea enjoy different comparative advantages in the world market (Table 1). According to internationally adopted standards, an RCA index of over 2.5 refers to an extremely strong competitiveness, 1.25~2.5 indicates a comparatively strong competitiveness, 0.8~1.25 suggests a moderate competitiveness and less than 0.8 means a weak competitiveness.
Electronics: electronics of China, Japan and Korea are all competitive in the world. Korea's RCA is 1.99 as compared to China (1.59) and Japan (1.45), showing stronger comparative advantages in world market.
Textile and garment: China's textile and garment industry shows a prominent competitiveness in world market, with an RCA of 3.09, Korea (1.05) is moderately competitive, while Japan is not competitive.
Table 1 International Competitiveness of China, Japan and Korea's Key Manufacturing Industry (RCA, 2002~2005)
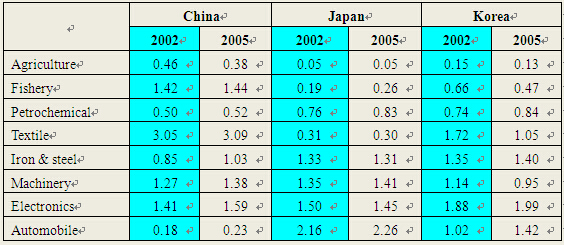
Note: ① RCA refers to the ratio between the proportion of Product K in a country's total exports and the proportion occupies by product K in the total global exports. Formula of RCA is

, with X indicating export, k indicating the categories of the export goods, j indicating the involved country, and w indicating the world. ② Classification of HS codes: Agriculture: Chapters 1~2 /4~15/17~24; Fishery: Chapters 3/16; Textile: Chapters 50~63; Petrochemical: Chapters 28~40; Iron & steel: Chapters 72~73; Machinery: Chapter 84; Electronics: Chapter 85; Automobile: Chapter 87.
Data: UN COMTRADE database, HS2002 classification.
Automobile: Japan shows evident comparative advantages in automobile industry, with an RCA of 2.26. Korea's automobile industry (1.42) is also competitive in the world. RCA for China's automobile industry is only 0.23, showing weak competitiveness.
Heavy and chemical industries: in iron & steel, machinery and petrochemical industries, China, Japan and Korea are all moderately or comparatively competitive, but China is evidently less competitive than Japan and Korea, and Korea is less competitive than Japan.
To analyze the dynamic development of the industrial competitiveness of China, Japan and Korea, we have made a comparison related to RCAs of China, Japan and Korea in 2002 and 2005, and the results suggest that China's competitiveness in iron & steel, machinery, electronic and automobile industries has all been enhanced; the competitiveness of Japan's industries have not changed much, with Japan's competitiveness in petrochemical, machinery and automobile industries continuing to improve; Korea's comparative advantages in automobile and electronic industries have improved remarkably, but its competitiveness in textile, garment and machinery has weakened.
2. Comparative advantages in regional trade
To compare the competitiveness of China, Japan and Korea's key industries in Northeast Asia's regional trade, we have used the index of regional revealed comparative advantage (RRCA). An RRCA index of more than 1 suggests the sector possesses comparative advantages in regional trade. The bigger the figure is, the stronger the advantages will be.
Results from the calculation (Table 2) suggest that China has obvious comparative advantages in textile and garment industries in regional trade and the advantages are continuously enhancing. During 2002~2005, China's competitiveness in petrochemical, iron & steel and machinery industries also improved, yet still remained weak compared to Japan and Korea.
Korea's electronic industry has the strongest comparative advantages among the three countries. Its petrochemical, iron & steel industries are also competitive in regional trade, and the comparative advantages of its automobile industry have improved remarkably in regional trade, with an RRCA value higher than that of Japan in 2005, which was mainly a result from the drastic increase in its export of automobiles and spare parts to China.
Among the three countries, Japan has the most remarkable advantages in manufacturing industry, with its RRCAs for petrochemical, iron & steel, machinery and automobile industries being the highest, only the RRCA index of its electronic sector was slightly inferior to that of Korea.
Table 2 Comparison of China, Japan and Korea's Competitiveness in Regional Trade and the Trend for Dynamic Development
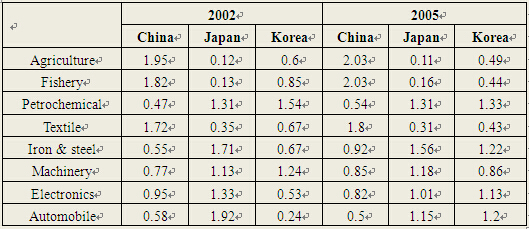
Note: ① RRCA refers to the ratio between the proportion of Product K in a country's total exports to other countries of the region and the proportion occupies by product K in the total exports of the region. ② Classification of HS codes: Agriculture: Chapters 1~2 /4~15/17~24; Fishery: Chapters 3/16; Textile: Chapters 50~63; Petrochemical: Chapters 28~40; Iron & steel: Chapters 72~73; Machinery: Chapter 84; Electronics: Chapter 85; Automobile: Chapter 87. Data: UN COMTRADE database, HS2002 classification.
In general, China enjoys low labor cost and low economic scale and large production capacities. Thus, its comparative advantages centered on labor-intensive industries or labor-intensive processing links. By attracting foreign investment and introducing advanced technologies in a large scale, China also enjoys the late-start advantage in new and hi-tech industries. By contrast, Japan and Korea boast stronger technological abilities and R&D capabilities, which offer them stronger comparative advantage in capital-intensive and technology-intensive industries. In these industries, Japan is more competitive than Korea.
…
If you need the full text, please leave a message on the website.
1Source: the National Statistical Bureau of China.
2Japan Statistical Yearbook 2007, Ministry of Internal Affairs and Communication, Japan.
3National Statistical Office (NSO), Korea.
4International Trade Statistics 2006, WTO.
5Trade figures from WTO’s International Trade Statistics for 2006 and the GDP figures from the National Statistical Bureau of China, Japan Statistical Yearbook 2007 and National Statistical Office (NSO), Korea.


