


We have launched E-mail Alert service,subscribers can receive the latest catalogues free of charge

Analysis of the CPI Trends in 2010 and the Forecast of These Trends in 2011
Aug 30,2011


By Liu Tao, Research Team of "Dynamic Analysis of China's Market Trend", Institute of Market Economy of Development Research Center of the State Council (DRC)
Research Report No 2, 2011
I. Main Features of CPI Changes in 2010
In 2010, China's CPI has been on the constant increase. Specifically, from January to November, CPI changes showed the following features:
(I) Growth of CPI started at a low level but remained at a high level and the pressure of CPI growth gradually intensified.
From January to November, CPI increased by an accumulative total of 3.2% from a year ago. Of this total, CPI increased by the lowest rate of the year to 1.5% in January, whereas it went up by 3% after July and to 5.1% in November, which was the highest since August of 2008. By monthly link relative ratios, the CPI growth expanded on a monthly basis during the later half of the year and to 1.1% (See Figure 1) in November. At the same time, of eight major categories of commodities, prices of five categories went up and those of other three categories declined. Prices of food, cigarettes, liquor, medical-care commodities, personal articles, recreational, educational and cultural products and services and homes increased by 7.0%, 1.6%, 3.1%, 0.6% and 4.3% respectively, year on year; prices of clothes, transportation and communication, household appliances and maintenance service dropped by 1.1%, 0.3% and 0.1% respectively, year on year.

Figure 1 CPI Changes during January and November, 2010
Source: National Bureau of Statistics.
(II) Drastic rise in prices of foodstuffs, vegetable and fruit drove up CPI most significantly.
In 2010, food prices rose evidently, playing the most conspicuous role in fuelling the CPI growth. According to the calculation of the average weight of the eight categories of commodities to CPI , of the rise of 3.2 percentage points in CPI from January to November, food prices generated 2.28 percentage points, accounting for 71.1% of the CPI growth. The percentage of food prices in fuelling CPI declined before the rise on the monthly basis, diminishing from 80.2% in January to 63.9% in June and later on rising month by month to 74.6% (See Figure 2) in November.
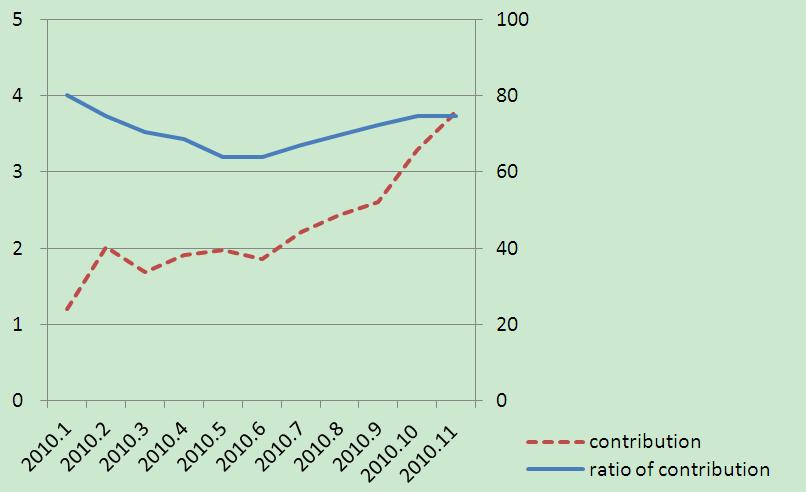
Figure 2 Contribution of Food Price Rise to CPI Growth and its Percentage During January and November, 2010
Unlike the price rise in March, 2007 and in October, 2008, the food price rise in 2010 was mainly attributable to the drastic rise in prices of foodstuffs, vegetable and fruit. According to the calculation of the average weight of the prices spent on foods to food prices, the rise in food stuff prices drove up food prices by 3.48 percentage points from January to November, making up 49.7% of the rise in food prices;the rise in vegetable and fruit prices fuelled the rise in food prices by 1.94 percentage points and 0.66 percentage points, making up 27.7% and 9.4% of the rise in food prices. Thus it can be seen that the rise in prices of foodstuffs, vegetable and fruit alone drove up food prices by more than 85%.
(III) The constant rise in housing prices played an important role in fuelling the CPI growth.
In 2010, housing price rise started at a low level before they went up as compared to the same period of the previous year, increasing progressively from 2.5% in January to 5.8% in November. According to the calculation of the average weight of the eight major categories of commodities to CPI, from January to November the rise in housing prices drove up the CPI growth by about 0.69 percentage points, namely, 21.5% of the CPI growth of 3.2 percentage points was fuelled by the rise in housing prices. In June, the ratio of the contribution generated by the housing prices to CPI growth reached the peak value of 27.6%, and then CPI growth declined and remained stable and reached 18.2% (See Figure 3) in November.
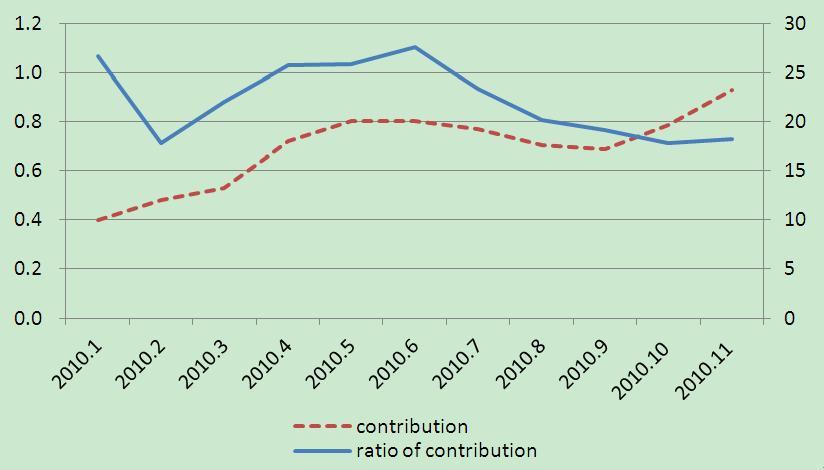
Figure 3 Contribution Generated by the Rise in Housing Prices to CPI Growth and the Relevant Ratio During January and November 2010
In addition, contribution to CPI growth generated by the rise in prices of wine, cigarettes and relevant articles, medical-care and personal articles, recreational, educational and cultural products and services reached 0.17 percentage points, 0.21 percentage points and 0.08 percentage points respectively from January to November, making up 5.3%, 6.6% and 2.4% of the CPI growth respectively. Thus it can be seen that the ratio of contribution generated by the rise in housing prices to CPI growth was second only to that of food prices, which played a vital role in driving up the CPI growth.
(IV) CPI carryover effect skyrocketed before declining and new price rise factors were curbed before they were let loose.
Carryover effect exerted an influence over CPI growth accounting for 1.4% of the entire 3.2% of growth during January and November, making up 43.8% of the total. Monthly, the percentage occupied by the carryover effect continued to go up after it fell in January and February and gradually declined after it reached its peak of 2.3% in June. Affected by myriad factors such as holidays and abnormal climate, the new price rise factors were curbed before they were let loose and their influencing role was constantly intensified after the role reached the peak value of 0.6% in June. In November, the role reached 4.1% (See Figure 4).
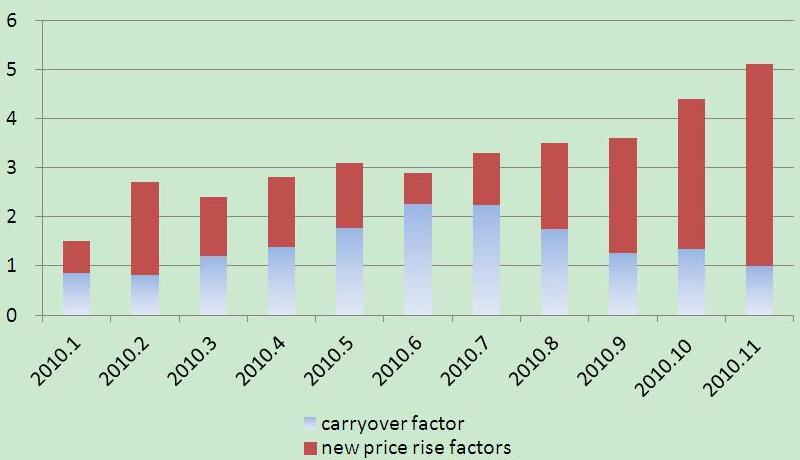
Figure 4 Influence of Carryover Effect and New Price Rise Factors on CPI Changes During January and November, 2010
With the gradual implementation of a series of state policies bringing prices under control, it is predicted that CPI growth will decline substantially in December and CPI for the whole year will be around 3.3%.
II. Analysis of the main factors driving up the CPI growth in 2010
Overall, CPI growth has been driven up by the following factors.
(I) Demand growth and the tight supply of some agricultural products have fueled the CPI growth.
The supply-demand situation is a basic factor determining the price change. In terms of the gross total, CPI has a positive correlation with the long-term increase of the total volume of the retail sales of consumer goods, namely, with the ever-increasing total volume of the retail sales of consumer goods in the medium-term and long run, CPI will grow in the medium- and long-term periods. Nevertheless, the total retail sales volume and the CPI growth will not take place synchronically. Usually, the medium- and long-term fluctuations of the total retail sales volume will occur about 23 months ahead of CPI fluctuations (See Figure 5). Thus, it can be judged that since 2010 the cyclical growth of CPI has been an inevitable result of the rapid demand growth which has happened since 2008.
...
If you need the full context, please leave a message on the website.
1The average weight is worked out by setting up the regression model for contribution of prices of eight major categories of commodities to CPI from January 2006 to November 2010. Of this weight, food accounts for 32.5%, cigarettes, wine and relevant articles account for 10.6%, clothes account for 5.9%, household appliances and maintenance account for 3.6%, medical-care and personal articles account for 6.9%, transportation and communication account for 11.7%, recreational, educational and cultural products and services account for 12.7% and housing accounts for 16.0%.


