


We have launched E-mail Alert service,subscribers can receive the latest catalogues free of charge

Tax Revenue's Deviation from Tax Sources Detrimental to Coordinated Regional Development
Aug 30,2011


Pan Wenxuan & Gao Shiji
Tax sources constitute the economic source of tax revenue. In the normal circumstances, a region's tax revenue should be consistent with its tax sources. In other words, a region that provides more tax sources should receive more tax revenue. But in reality, tax revenue often deviates from tax sources due to the complexity of tax system designs and production and operational activities. While a region with tax sources fails to receive tax revenue, another without tax sources can receive tax revenue. This deviation violates the principle that tax revenue should be consistent with tax sources. It distorts the stimulation mechanism for economic activities, creates inter-regional imbalance in fiscal resources and leads to uncoordinated regional development. The deviation of tax revenue from tax sources is rather prominent in China, and has become an undeniable constraint to coordinated regional development. Accordingly, solving this deviation is important not only to rationalizing the distribution of fiscal resources among different regions, but also to promoting coordinated regional development.
I. Facts about Tax Revenue's Deviation from Tax Sources in China 1. Overview of Tax Revenue's Deviation from Tax Sources
In this report, the deviation of tax revenue from tax sources relates to inter-regional ties and is expressed in the horizontal transfer of tax revenue between different regions. It does not cover the regional-to-central vertical transfer of tax revenue arising from central taxes or central-regional shared taxes. Before making a quantitative analysis of the deviation of tax revenue from tax sources, we need to put forward two hypotheses. One is to assume the tax rates in different regions are roughly identical. The other is to assume different regions have an identical structure of tax sources, which means the same quantity of gross regional product contains the same quantity of tax sources. On this basis, the degree of the deviation of tax revenue from tax sources can be measured by the difference between the ratio of a region's own tax revenue to the country's total tax revenue and the ratio of the region's own gross regional product to the country's gross domestic product:
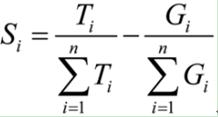
Specifically, Si represents the degree of the deviation of regioni's tax revenue from its tax sources, Ti represents regioni's own fiscal revenue, Gi represents regioni's gross regional product, and
and  respectively represent the ratio of regioni's own tax revenue to the country's local tax revenue and the ratio of regioni's gross regional product to the country's gross domestic product. When Si>0, regioni has a net tax revenue inflow; when Si<0, regioni has a net tax revenue outflow. Then we work out the degree of the deviation of tax revenue from tax sources for China's 31 provinces and its four major regions, and tables 1 and 2 show the results.
Table 1 Degree of Tax Revenue-Tax Source Deviation in China's 31 Provinces (%)
|
Province |
2004 |
2005 |
2006 |
2007 |
2008 |
Mean value |
|
Beijing |
3.28 |
3.05 |
3.08 |
4.21 |
4.62 |
3.65 |
|
Tianjin |
-0.04 |
0.04 |
0.20 |
0.44 |
0.39 |
0.21 |
|
Hebei |
-1.24 |
-1.25 |
-1.20 |
-1.67 |
-1.64 |
-1.40 |
|
Shanxi |
-0.20 |
0.01 |
0.06 |
0.29 |
0.45 |
0.12 |
|
Inner Mongolia |
0.15 |
0.18 |
0.17 |
-0.33 |
-0.33 |
-0.03 |
|
Liaoning |
1.41 |
1.16 |
1.00 |
0.17 |
0.11 |
0.77 |
|
Jilin |
-0.61 |
-0.70 |
-0.77 |
-0.69 |
-0.64 |
-0.68 |
|
Heilongjiang |
-0.79 |
-1.00 |
-0.95 |
-0.77 |
-0.69 |
-0.84 |
|
Shanghai |
4.33 |
4.48 |
3.82 |
5.94 |
5.54 |
4.82 |
|
Jiangsu |
1.35 |
1.52 |
1.49 |
0.31 |
0.31 |
1.00 |
|
Zhejiang |
2.41 |
2.84 |
2.84 |
1.10 |
1.08 |
2.05 |
|
Anhui |
-0.26 |
-0.05 |
0.12 |
-0.63 |
-0.52 |
-0.27 |
|
Fujian |
-0.51 |
-0.19 |
-0.07 |
-0.30 |
-0.29 |
-0.27 |
|
Jiangxi |
-0.87 |
-0.92 |
-0.88 |
-0.59 |
-0.53 |
-0.76 |
|
Shandong |
-3.69 |
-3.82 |
-3.88 |
-2.83 |
-3.14 |
-3.47 |
|
Henan |
-2.53 |
-2.82 |
-2.72 |
-2.24 |
-2.50 |
-2.56 |
|
Hubei |
0.04 |
0.11 |
0.06 |
-1.10 |
-1.15 |
-0.41 |
|
Human |
-1.53 |
-1.50 |
-1.46 |
-1.26 |
-1.41 |
-1.43 |
|
Guangdong |
-0.44 |
-0.55 |
-0.61 |
1.27 |
1.66 |
0.26 |
|
Guangxi |
-0.64 |
-0.75 |
-0.82 |
-0.71 |
-0.75 |
-0.74 |
|
Hainan |
0.13 |
0.13 |
0.13 |
0.01 |
0.07 |
0.09 |
|
Chongqing |
0.14 |
0.19 |
0.34 |
-0.04 |
-0.04 |
0.12 |
|
Sichuan |
-0.90 |
-0.93 |
-0.83 |
-0.59 |
-0.70 |
-0.79 |
|
Guizhou |
-0.04 |
-0.05 |
-0.01 |
0.14 |
0.14 |
0.04 |
|
Yunnan |
0.99 |
0.88 |
0.88 |
0.33 |
0.34 |
0.68 |
|
Tibet |
-0.06 |
-0.06 |
-0.07 |
-0.06 |
-0.05 |
-0.06 |
|
Shaanxi |
0.26 |
0.25 |
0.30 |
-0.06 |
-0.06 |
0.14 |
|
Gansu |
0.04 |
-0.01 |
0.01 |
-0.20 |
-0.24 |
-0.08 |
|
Qinghai |
0.03 |
0.05 |
0.05 |
-0.05 |
-0.03 |
0.01 |
|
Ningxia |
-0.03 |
-0.02 |
-0.03 |
-0.01 |
0.01 |
-0.01 |
|
Xinjiang |
-0.18 |
-0.27 |
-0.27 |
-0.09 |
0.00 |
-0.16 |
Table 2 Degree of Tax Revenue-Tax Source Deviation in China's Four Major Regions (%)
|
Region |
2004 |
2005 |
2006 |
2007 |
2008 |
Mean value |
|
East |
5.58 |
6.25 |
5.80 |
8.48 |
8.60 |
6.94 |
|
Northeast |
0.02 |
-0.54 |
-0.72 |
-1.29 |
-1.22 |
-0.75 |
|
Central |
-5.35 |
-5.17 |
-4.82 |
-5.53 |
-5.66 |
-5.30 |
|
West |
-0.25 |
-0.54 |
-0.26 |
-1.66 |
-1.71 |
-0.88 |
Note: Based on China Statistical Yearbooks, the same below.
From the above tables, we can draw the following basic conclusions: First, in terms of the direction of transfer, tax revenue mainly flows to the east region from other three regions. In particular, the flow from the central region is all the more prominent. Of the 14 provinces that post net tax revenue inflow, seven are in the east region, five are in the west region, and one each is in the northeast and central regions. Of the 17 provinces that post net tax revenue outflow, seven are in the west region, five are in the central region, three are in the east region, and two are in the northeast region. Second, Shanghai and Beijing are the two provinces posting the most prominent tax revenue inflow and Shandong and Henan are the two provinces posting the most prominent tax revenue outflow. In terms of the degree of tax revenue-tax source deviation (this report defines  as a high degree of deviation,
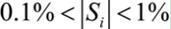 as the median degree of deviation, and
 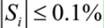 as the low degree of deviation), eight provinces post a high degree of deviation. They are Shanghai, Beijing, Shandong, Henan, Zhejiang, Hunan, Hebei and Jiangsu (in the order of deviation degree). In particular, Shanghai, Beijing, Zhejiang and Jiangsu are the provinces posting net inflow, and the degrees of net tax revenue inflow of Shanghai and Beijing are far higher than those of other provinces. This means large amounts of tax revenue flows to the two centrally-administered municipalities.
Third, the degree of tax revenue-tax source deviation tends to widen on the whole, with the tax revenue flow from other major regions to the east region being constantly intensifying. The change of the degree of tax revenue-tax source deviation among the four major regions in the past five years indicates that the degree of deviation of the east region rose from 5.58% in 2004 to 8.60% in 2008. In the meantime, the degree of deviation (in absolute value) of three other major regions also rose, though in different degrees. In particular, the west region posted the most dramatic rise, or 1.46 percentage points higher.
The above conclusions are worked out on the basis of the above said two hypotheses. If the two hypotheses are eased and if the inter-regional differences in tax rates and tax source structures are taken into account, we discover that the above-said degrees of deviation of tax revenue from tax sources are somewhat overestimated. However, the basic trend of tax revenue flowing to the east region from other three major regions does not change. The central region remains the place where the degree of outflow is highest and where the tax revenue-tax source deviation tends to widen. So even though the two hypotheses can lead to some numerical deviation, they do not have substantial impacts on the results of empirical analysis.
...
If you need the full context, please leave a message on the website.


