


We have launched E-mail Alert service,subscribers can receive the latest catalogues free of charge

China's Carbon Intensity over the Next Decade: Its Reduction Would Slow down the Growth of Total Emissions
Aug 18,2015


By Liu Peilin, Research Team on "Features, Challenges and Strategic Choices of China's Near-to-mid term Economic and Social Development" of DRC
Research Report No 92, 2013(Total 4341)
I. Introduction
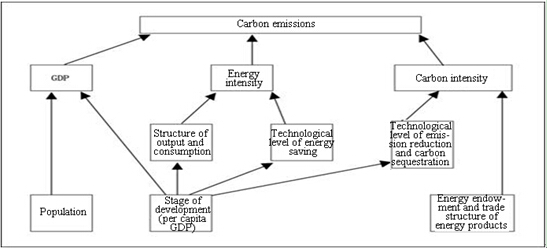
The carbon emissions1 of an economy depend on three factors: total GDP, the amount of energy consumed per unit of GDP (hereinafter referred to as energy intensity), and the carbon emissions generated per unit of energy consumption (hereinafter referred to as carbon intensity). These three factors are then determined by two categories of influencing factors: The first category is related to the stage of development, including the structure of output and consumption, the technological level of energy saving, emission reduction and carbon sequestration, etc.; the second category is associated with the energy endowment and the trade structure of energy products, i.e., when other conditions are the same, fossil fuel-dependent countries produce more carbon emissions than those depending on non-fossil energy. Figure 1 outlines what determines carbon emission.
To predict carbon emissions, it is necessary to grasp the trends of the above factors. There are two ways to do this: The first is to build specialized prediction models, which requires a number of exogenous assumptions; the second is the method of empirical analogy which refers to the use of the experience of other developed economies in similar stages of development to predict by analogy the future trend of related factors in China. The latter has the following characteristics: Firstly, it is relatively simple; secondly, it does not need a lot of exogenous assumptions. In addition, it is not inferior to complex models, if viewed from the perspective of the reliability of predictions made with it, especially the reliability of predictions about basic trends.
This paper will focus specifically on tracing the past trends of energy intensity and carbon intensity in some developed economies as time went by and their development stage changed, and then check China's targets of energy saving and emission reduction against these trends. By doing so, we will be able to predict the future trend of China's energy intensity and carbon intensity. Further, we can combine the predictions with the economic growth forecasts, and predict China's future trend in carbon emissions.
II. International Experience Concerning Carbon Emissions
The twenty countries with the highest total carbon emissions in the world are China, the United States, India, Russia, Japan, Germany, Iran, Canada, South Korea, South Africa, the United Kingdom, Indonesia, Mexico, Saudi Arabia, Italy, Australia, Brazil, France, Poland, and Spain. In 2009, the carbon emissions of these twenty countries accounted for 81.2% of the global total (Boden et al., 2012). By analyzing and summarizing the situations in these countries, we can grasp the basic pattern of carbon emissions in the world. Moreover, most of these countries are relatively large and therefore share more common ground with China and their experience provides more enlightenment for China's carbon emission control in the future. In view of this, this paper will mainly focus on these countries, but Iran and Saudi Arabia are not included since their industrial structures are quite different from that of China.
1. Carbon emission trajectories of different countries fall into three types
The trajectories of total carbon emissions of the eighteen countries (including China) since 1950 can generally be divided into the following types:
The first are those countries whose emissions reached the peak value more than thirty years ago and showed an obvious tendency of decrease afterwards, including France, Germany, the UK, Russia and Poland. It is noticeable here that among them, France, Germany and the UK are mature industrialized countries while Russia and Poland are less-developed in comparison, so it remains to be seen whether a new round of sustained growth will appear in these two countries.
The second type are those whose emissions reached the peak value only several years ago and has showed signs of a slight decrease which need to be confirmed by the future trends. These countries include such high-income developed economies as the United States, Italy, Spain, Canada and Japan. Their carbon emissions, due to the short-term impact induced by the financial crisis, have shown signs of a decline in recent years, but whether these signs indicate a long-term downward trend is yet to been confirmed.
The third type are those whose carbon emissions remain on the rise, including Australia, South Korea, Mexico, Brazil, Indonesia, South Africa, India and China. There are big differences among these countries. Australia and South Korea are high-income economies, while the others, still belonging to the middle-income group, have not yet completed the task of industrialization.
2. Total carbon emissions can be reduced considerably only when the energy intensity and carbon intensity decrease significantly and simultaneously
As mentioned above, total emissions are determined by three factors: GDP, energy intensity and carbon intensity. The above three types of total emissions trajectories are actually different scenarios resulted from varied combinations of GDP growth, energy intensity and carbon intensity in different countries. From the end of World War II to the first decade of this century, there has been a sustained and steady economic growth in the world. From the end of World War II to the 1970s, in particular, the global economy enjoyed a rapid and continuous growth. In this context, only when the energy intensity and carbon intensity decrease by a margin larger than that of economic growth can the carbon emissions be reduced continuously.
International experience shows that the first type of countries whose carbon emissions reached a peak value more than thirty years ago and showed an obvious tendency of decrease after that, i.e., the UK, France and Germany, have experienced an evident decline in both energy intensity and carbon intensity.
If there is only a reduction in energy intensity, but no apparent and simultaneous decrease in carbon intensity, the total carbon emissions will not take on an obvious downward trend. This is the case with the United States, Canada and Australia. Similarly, if only the carbon intensity is reduced considerably, but not the energy intensity, the total carbon emissions will not decrease significantly either, just as it had been proved in Spain and South Korea.
…
If you need the full text, please leave a message on the website.
1This paper will not cover all carbon emissions; instead, it deals only with carbon emissions generated by energy consumption. It does not touch upon carbon sinks either.


